Supply Chain Inventory Dashboard
Inventory Optimization Dashboard for a Mid-Sized Footwear Company (X)
Situation Analysis
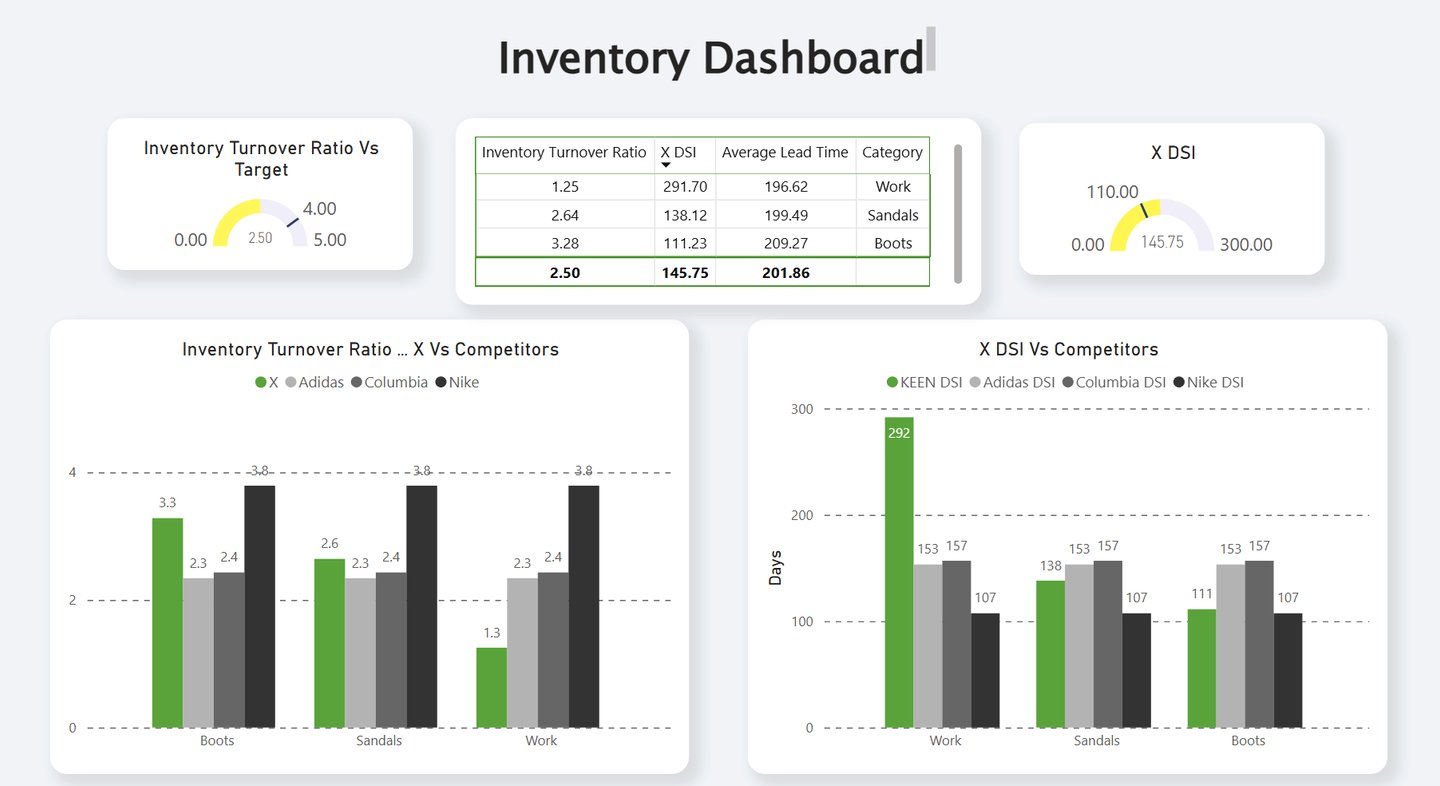
Company X currently holds an average Days Sales of Inventory (DSI) of 202 days—significantly higher than key competitors Nike, Columbia, and Adidas, whose DSIs range from 107 to 157 days. Notably, Company X’s Work Boot category has an exceptionally high DSI of 292 days, representing nearly 10 months of stock on hand. These high inventory levels appear to be driven by extended lead times (averaging over 200 days), which has led to precautionary ordering and excessive safety stock.
Value Provided by Dashboard
The dashboard clearly identifies critical inventory inefficiencies and quantifies potential financial gains from inventory optimization:
Immediate Cost Reduction: Reducing Company X’s average DSI from 202 days to a more conservative industry benchmark of 150 days would result in immediate storage and holding cost savings. For instance, lowering inventory from approximately $2.25 million to $1.70 million (if DSI drops to 110) could generate estimated savings of over $550,000.
Improved Cash Flow: With an inventory turnover rate of just 2.50—well below the target of 4.0—the dashboard highlights a major opportunity to free up cash and reduce working capital tied up in inventory.
Actionable Recommendations
Targeted Inventory Reduction:
Phase down or offer strategic discounts for Work Boot inventory.
Adjust demand forecasts and reduce reorder quantities to better align with actual market demand.
Lean Inventory Management:
Transition to Economic Order Quantity (EOQ) and demand-driven replenishment models to avoid overstocking.
Explore phased shipments to mitigate overstock risks without sacrificing product availability.
Supply Chain Agility:
Negotiate lead time reductions of 30–50 days to directly reduce safety stock requirements and inventory holding costs.
Benchmark practices against industry leaders (e.g., Nike’s turnover rate), with a goal of increasing turnover from 2.5 to at least 3.5—significantly improving Company X’s inventory efficiency.
This dashboard enables Company X to clearly visualize inventory challenges, quantify potential savings, and implement strategic, data-driven actions to improve supply chain performance, reduce costs, and boost overall agility.